Maximizing Impact: Customized Reporting Solutions for Nonprofits and Small Businesses
- Meagan Foster
- Feb 13, 2024
- 3 min read
In the dynamic landscape of nonprofits and small businesses, data serves as a catalyst for growth, innovation, and social impact. Whether it's measuring program outcomes, tracking financial performance, or engaging stakeholders, leveraging data effectively is essential to achieving organizational goals and driving sustainable success. In this blog post, we'll explore the importance of data analysis and reporting for nonprofits and small businesses and offer insights into creating tailored reporting solutions to meet their unique needs.
The Value of Data Analysis and Reporting
Nonprofits and small businesses operate in resource-constrained environments where every decision matters. By harnessing the power of data analysis and reporting, organizations can:
Inform Strategic Decision-Making: Data-driven insights enable organizations to make informed decisions about resource allocation, programmatic priorities, and strategic partnerships, ensuring that efforts are aligned with mission and goals.
Enhance Accountability and Transparency: Reporting data on program outcomes, financial performance, and impact metrics fosters accountability, transparency, and trust with stakeholders, including donors, funders, customers, and the community at large.
Drive Performance Improvement: By tracking key performance indicators (KPIs) and evaluating progress over time, organizations can identify areas for improvement, optimize operations, and drive continuous innovation and growth.
Demonstrate Impact and Return on Investment (ROI): Reporting data on outcomes and impact metrics allows organizations to demonstrate the effectiveness of their initiatives, secure funding, attract customers, and engage supporters who share their values and vision.

Creating Tailored Reporting Solutions
Building customized reporting solutions tailored to the specific needs of nonprofits and small businesses is essential for maximizing the value and utility of data. Here are some insights into creating effective reporting solutions:
Identify Key Metrics and Indicators: Begin by identifying the key performance indicators (KPIs), financial metrics, and impact measures that are most relevant to the organization's mission, goals, and stakeholders.
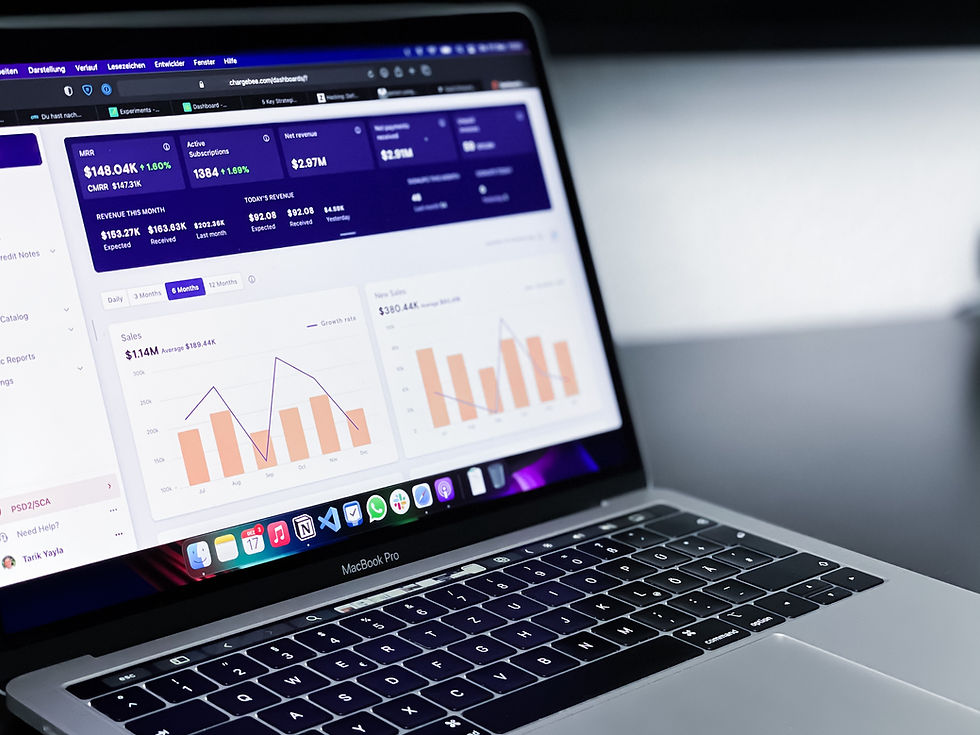
Design User-Centric Dashboards and Reports: Develop user-friendly dashboards and reports that present data in a visually appealing and easy-to-understand format. Customize reporting templates to meet the needs of different audiences, including board members, donors, customers, and employees.
Promote Data Accessibility and Actionability: Make data accessible and actionable to all stakeholders by providing online portals, interactive dashboards, and self-service reporting tools. Offer training and support to build data literacy and empower users to interpret and use data effectively in their work.
Ensure Data Quality and Timeliness: Implement robust data governance processes to ensure the accuracy, completeness, and reliability of the data used for reporting. Establish protocols for data collection, validation, and updating to ensure that information is up-to-date and relevant.
Customize Reporting for Stakeholder Engagement: Tailor reporting solutions to meet the needs and preferences of different stakeholders, including donors, customers, employees, and community partners. Solicit feedback and input from stakeholders to ensure that reporting solutions meet their expectations and deliver value.
Real-World Examples
Impact Reports for Donors and Funders: Customized impact reports highlight the outcomes and impact of nonprofit programs and initiatives, demonstrating the value and return on investment (ROI) for donors and funders.
Financial Dashboards for Small Businesses: Dashboards that track financial performance metrics such as revenue, expenses, and profitability help small businesses monitor cash flow, identify trends, and make informed financial decisions.
Customer Satisfaction Surveys and Reports: Reporting solutions for customer satisfaction surveys and feedback mechanisms provide insights into customer preferences, needs, and perceptions, guiding product development, marketing strategies, and customer service initiatives.
Conclusion
In an era of unprecedented data availability and technological advancement, nonprofits and small businesses have an unprecedented opportunity to harness the power of data to drive social impact, innovation, and growth. By building customized reporting solutions that leverage data analysis and visualization tools, organizations can unlock insights, inform decision-making, and catalyze positive change in the communities they serve. Let's embrace the transformative potential of data to create a brighter future for all.
Unleash Your Digital Readiness
70% of organizations report difficulties in bringing their digital transformation goals to fruition. Take this free assessment to evaluate your readiness and adaptability to embrace digital change.


